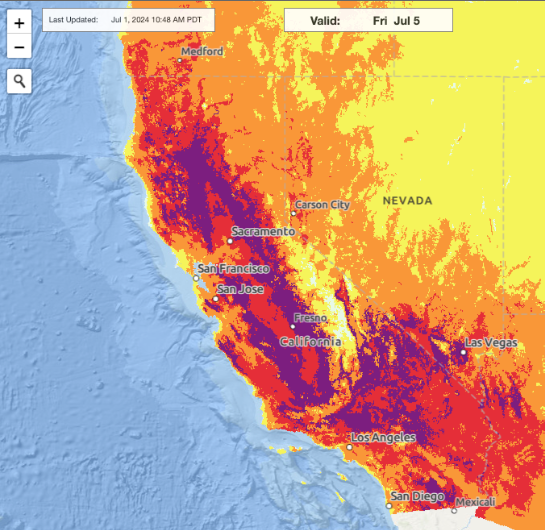
Have you ever heard of heat mapping? Ironically, it doesn't just map heat and temperature, but also pollution, climate and weather, ecology, and even natural hazards (ex: drought, volcanic activity . . .).
We'll go over what a heat map IS (and how heat maps are mapped), and what it reveals about the socioeconomic status of people in a certain area (inequality).
What a heat map IS + how it is mapped
Like we said, a heat map doesn't JUST model temperature, but various other environmental factors as well. But what IS it really?
According to the California Institute of Technology, a heat map is "a specialized chart that uses colors to represent data values in a table or physical map . . . they map the amount or concentration of certain measurements." Heat maps often use remote sensing (mostly satellites: something that collects data from afar) to collect data on a particular place.
There are mainly four factors included in heat mapping (although there are other, minor ones):
Land Surface Temperature
This is how warm the "surface" of the Earth is. By surface we mean directly at the ground: grass, concrete, soil, water bodies, and even building roofs count.
Climate/Weather Patterns
Climate is measured as the average weather conditions over a period of time. Heat maps often measure the climate of a particular location. Weather patterns are basically the same thing but over a way shorter amount of time: climate = 30 years or more, weather patterns = anything less than that.
Fire
Let's face it: fires are happening all the time somewhere in the world. When burning occurs completely (has enough oxygen for the combustion reaction to occur), only carbon dioxide and water vapor remain as byproducts. But most of the time, burning ISN'T complete, releasing carbon dioxide, methane, and carbon monoxide (all of which fuel climate change). Some heat maps map levels of carbon monoxide.
Sea Temperature/Chlorophyll Concentration
Did you know cold waters tend to have more nutrients than warm waters (that's why if you touch any river the water is not warm but cold)? That's why phytoplankton tend to be more plentiful where waters are cold (more nutrients for them to grow). Anyway, phytoplankton use chlorophyll (they're algae that use photosynthesis), and some heat maps map chlorophyll concentration (probably to look at how biodiverse a body of water is). Also, some heat maps map sea temperature.
So heat maps are used to study urban heat islands, climate patterns, water temperature, or land-surface temperature. Environmental scientists, firefighters, farmers (to see what parts of land are good for growing crops — they can't be too hot), and others use this, and would consider heat maps to be a valuable resource in their daily lives.
What this reveals about inequality
An estimate from USC Dornsife states that:
"People living in poverty are projected to experience the greatest heat-exposure disparities in 52% of U.S. states."
Black and Asian residents follow closely, facing widening exposure gaps compared to White and Hispanic populations.
Inequality is most pronounced in the nation's 30 largest metropolitan areas, where dense development and historical planning practices amplify urban heat.
In a sentence? Heat mapping shows that "socioeconomic and racial groups" (the poor, plus African Americans and Asians) will be affected the most.
But . . . how and why?
Urban heat islands x Redlining
Urban heat islands are "a metropolitan area that experiences significantly warmer temperatures than nearby rural areas."
But now I ask you: who do YOU think lives in these hotter areas? Surely not rich people, right?
Now this ties closely with something called redlining. Time for a history lesson! (Not really, don't worry.)
Redlining started during the Great Depression: the U.S. government and private lenders created color-coded maps of cities. And neighborhoods with mostly Black or minority residents were colored red and labeled "hazardous" or "undesirable" for investment (to buy).
So JUST BECAUSE the houses housed people of different races, they were deemed "unfit".
I know, right. Wow 😩. So cruel.
And over time, the houses that WERE deemed "fit" got more funding and private investment, leading to more greenery and space in more luxurious homes. This is good because A) plants are VERY good at cooling land and B) more space means less crowding, which means more space for nature and less for artificial, man-made structures (which increase heat).
So inequality has become so big that it's also affecting the environment. And the environment affects people's lives. Poor people are now living in hotter, more polluted conditions than ever due to climate change and other environmental problems. But we can stop that. We have the power to decide how to run our city. Forget helping the environment — we first must help each other: people of ALL races and genders. Are you willing to change?
References
Cimons, M. (2020, January 23). How redlining makes communities of color more at risk of deadly heatwaves. Peril & Promise. https://www.pbs.org/wnet/peril-and-promise/2020/01/redlined-neighborhoods/
Earth science data visualizations - How to read a heat map - Science lesson | NASA JPL Education. (2024). https://www.jpl.nasa.gov/edu/resources/lesson-plan/earth-science-data-visualizations-how-to-read-a-heat-map/
Kramer, A. (2025, December 9). "Heat will deepen social inequalities": New U.S. climate study reveals troubling trend. Spatial Sciences Institute, USC Dornsife. https://dornsife.usc.edu/spatial/2025/12/08/heat-will-deepen-social-inequalities-new-u-s-climate-change-study/
University Corporation for Atmospheric Research. (2021). Urban heat islands | UCAR Center for Science Education. https://scied.ucar.edu/learning-zone/climate-change-impacts/urban-heat-islands
Banner image credit: KTLA 5 News (heat mapping: California)